App Overview
This guide walks you through the main sections of the Chronom AI platform, so you can quickly find and use the tools you need.
Navigation Bar
The top navigation bar gives you access to every major area of the platform:
| Tab | Description |
|---|---|
| Environments | High-level dashboard across all managed customer environments |
| Home | At-a-glance cost overview, error spread, and active services for the current organization |
| Inventory | Cloud resource inventory, interactive cloud maps, and Microsoft 365 license management |
| Alerts | All policy-generated alerts with filtering by category and severity |
| Reports | Technical assessments, impact reports, and downloadable report archives |
| Settings (gear icon) | Organization settings, team management, scan schedules, and integrations |
Some tabs have dropdown sub-menus - hover over Inventory, Alerts, or Reports to see them.
Environments
The Environments page provides an MSP-style dashboard for organizations managing multiple customer accounts.
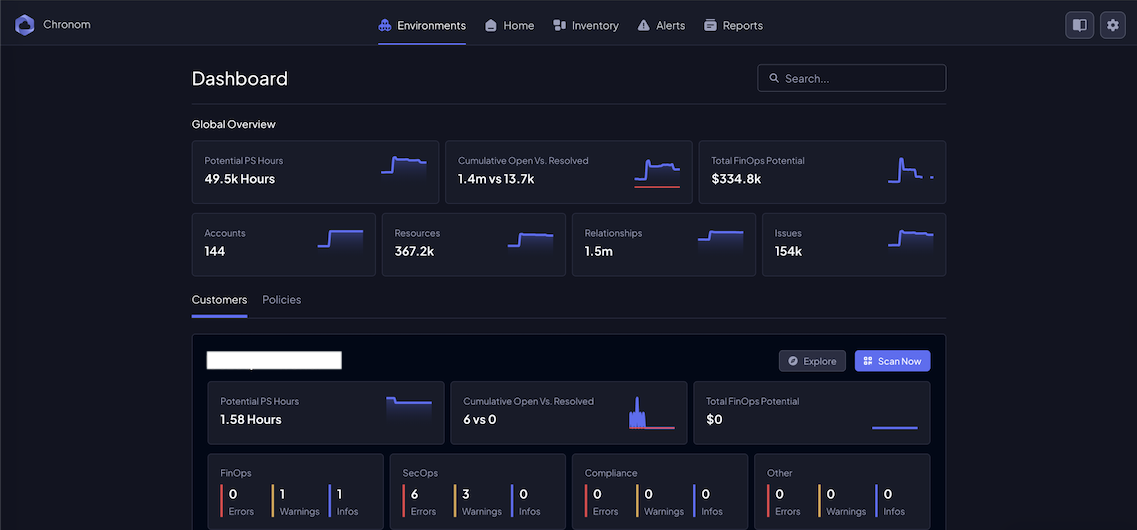
Global Overview
At the top you'll find key metrics across all accounts:
- Potential PS Hours - estimated professional-services hours identified by Chronom
- Cumulative Open Vs. Resolved - trend of open vs. resolved issues over time
- Total FinOps Potential - aggregate dollar savings identified across all accounts
- Accounts - number of connected cloud accounts
- Resources - total cloud resources under management
- Relationships - mapped relationships between resources
- Issues - total open issues
Customers and Policies
Below the overview, toggle between two tabs:
- Customers - a card for each customer environment showing Potential PS Hours, Cumulative Open Vs. Resolved, Total FinOps Potential, and a health breakdown by category (FinOps, SecOps, Compliance, Other). Each card includes Explore and Scan Now actions.
- Policies - view and manage policies applied across environments.
Use the Search bar in the top-right corner to quickly locate a specific customer environment.
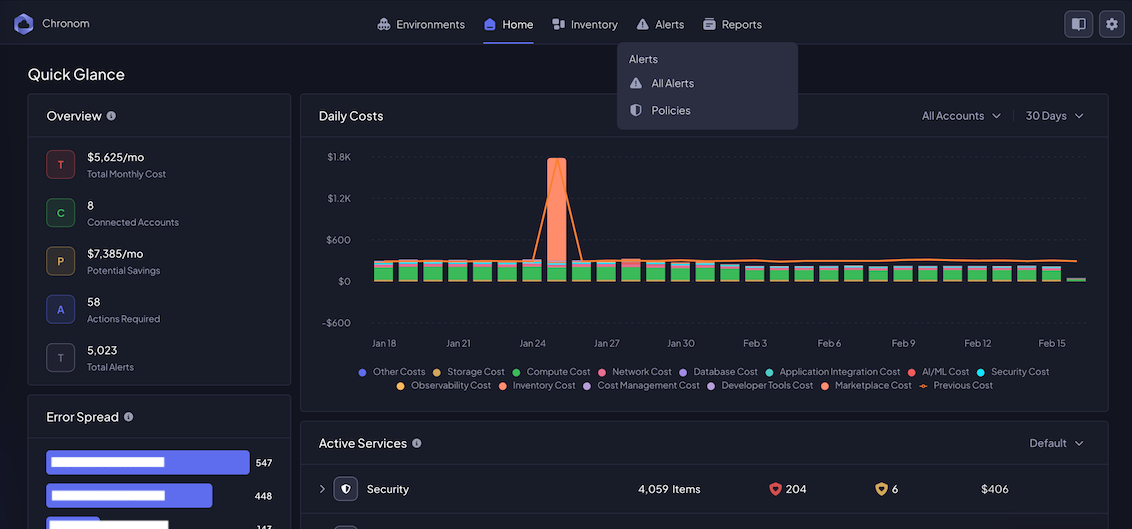
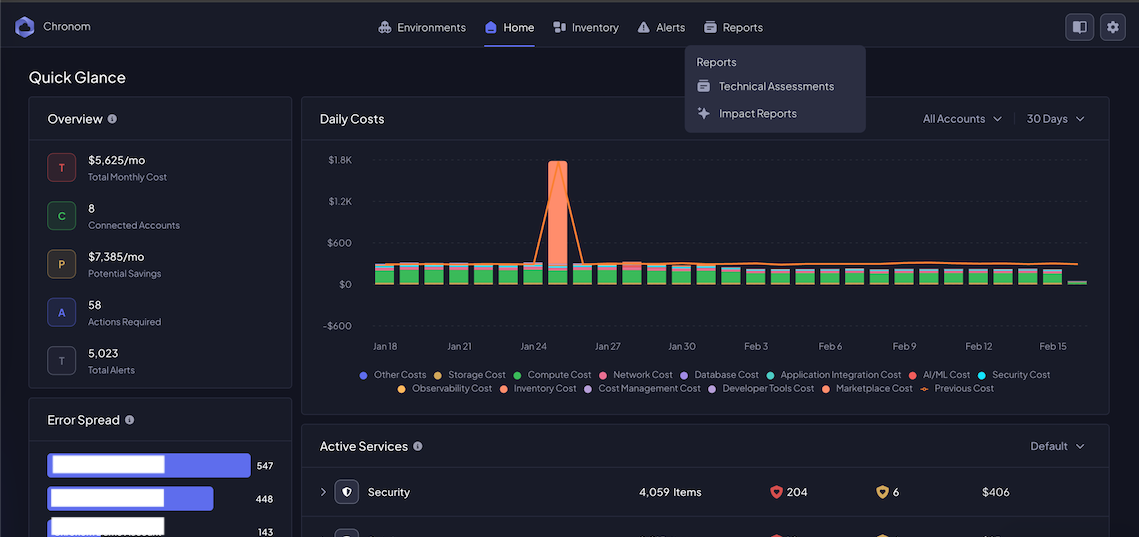
Home
The Home page is the landing screen for your organization, giving you a quick glance at cost and health data.
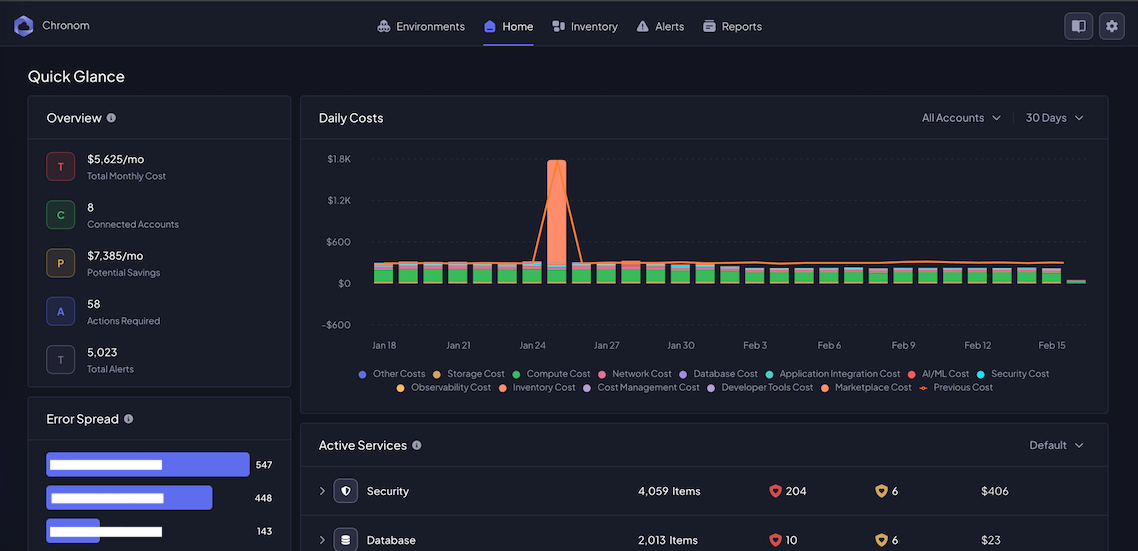
Overview Panel
The left-hand Overview card summarizes:
- Total Monthly Cost - current month's cloud spend
- Connected Accounts - number of cloud accounts linked to Chronom
- Potential Savings - monthly savings Chronom has identified
- Actions Required - alerts that need attention
- Total Alerts - overall alert count
Daily Costs
The Daily Costs chart displays a stacked bar graph of daily cloud spend, broken down by cost category:
Storage, Compute, Network, Database, Application Integration, AI/ML, Security, Observability, Inventory, Cost Management, Developer Tools, Marketplace, and more.
Use the All Accounts and 30 Days dropdowns to filter by account and time range.
Error Spread
The Error Spread panel shows how alerts are distributed across your connected accounts, helping you identify which accounts need the most attention.
Active Services
The Active Services table lists service categories (Security, Database, Compute, etc.) with:
- Items - number of resources in that category
- Errors (red) - critical issues
- Warnings (green) - non-critical findings
- Cost - monthly spend for that category
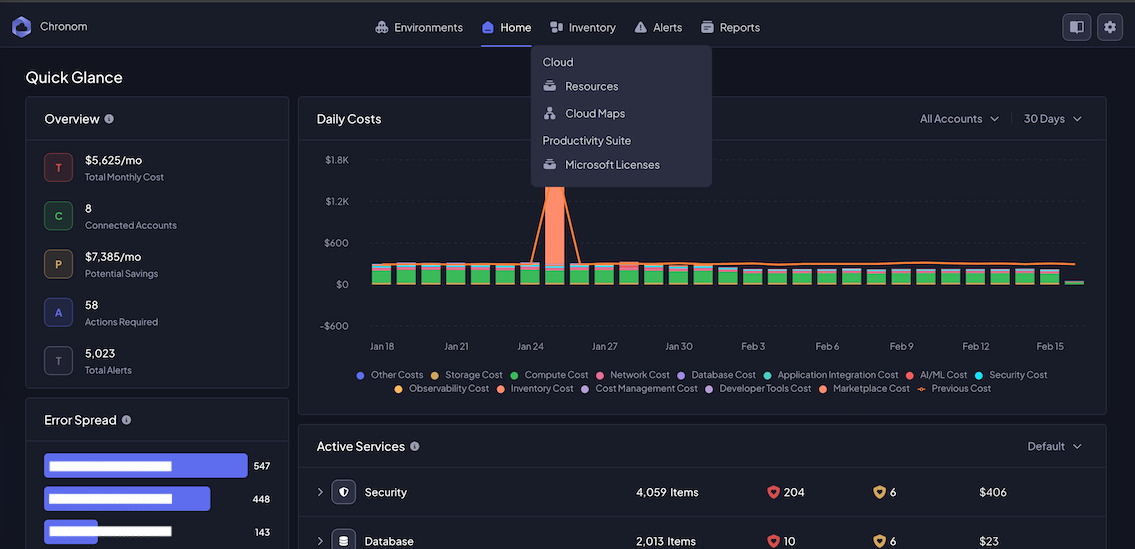
Inventory
The Inventory tab contains three sub-pages, accessible via the dropdown menu:
Resources (Asset Inventory)
A searchable, filterable table of every cloud resource Chronom has discovered.
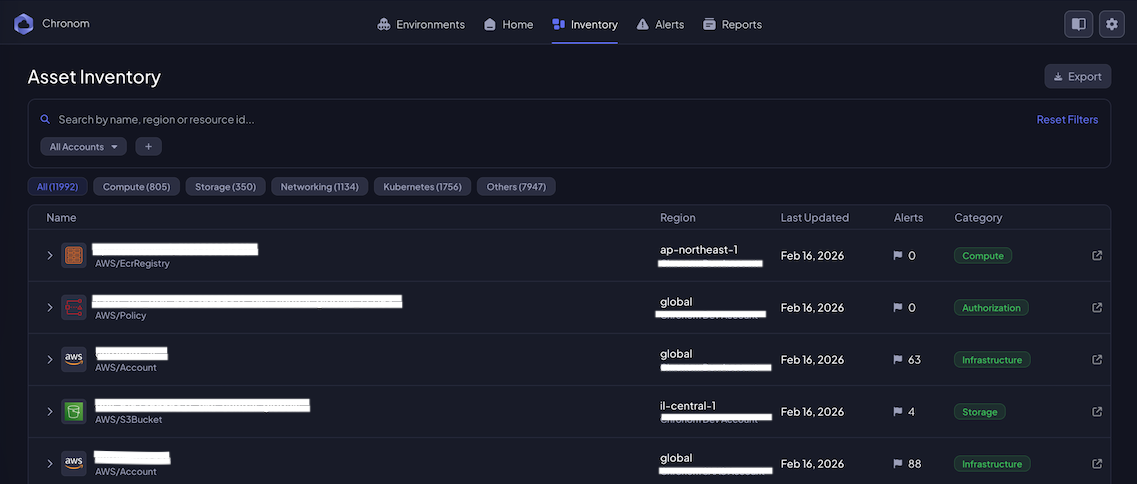
- Search - find resources by name, region, or resource ID
- Account filter - scope the view to a specific cloud account
- Category tabs - filter by Compute, Storage, Networking, Kubernetes, or Others (with counts)
- Resource details - each row shows the resource Name, type (e.g.
AWS/S3Bucket), Region, owning Account, Last Updated date, Alert count, and Category badge
Click the expand arrow on any resource to see full details, relationships, and associated alerts.
Use the Export button in the top-right corner to download the inventory as a file for offline analysis.
Cloud Maps
An interactive graph visualization of your cloud infrastructure topology.
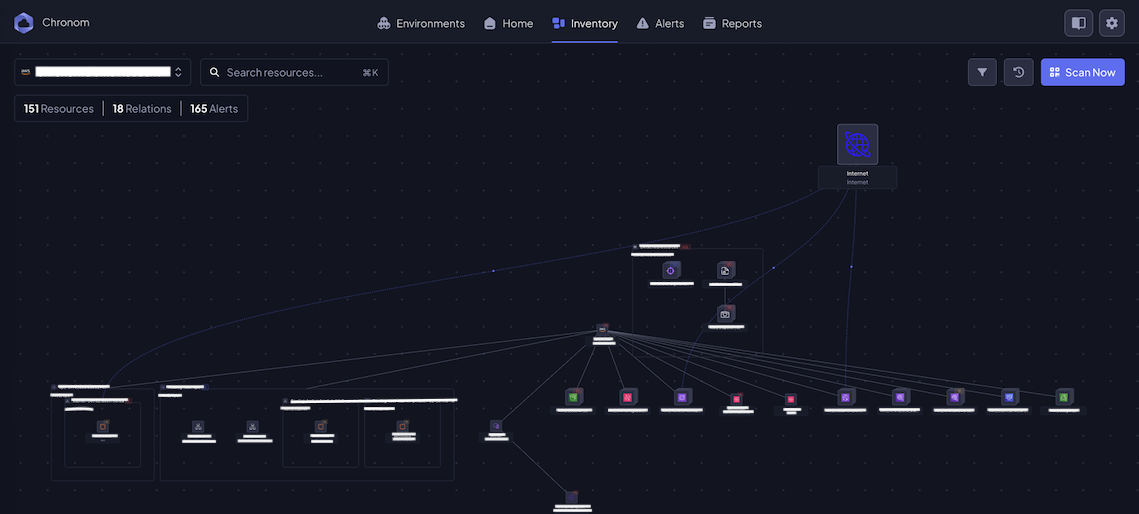
- Account selector - choose which cloud account to visualize
- Search - find specific resources within the map (
Cmd+K/Ctrl+K) - Summary bar - shows total Resources, Relations, and Alerts for the selected account
- Graph view - nodes represent resources, edges represent relationships (network routes, IAM bindings, etc.)
- Scan Now - trigger an on-demand scan of the selected account
Use the navigation controls in the bottom-right corner to pan, zoom, and re-center the map.
Microsoft Licenses
Overview of your organization's Microsoft 365 licenses and optimization opportunities.
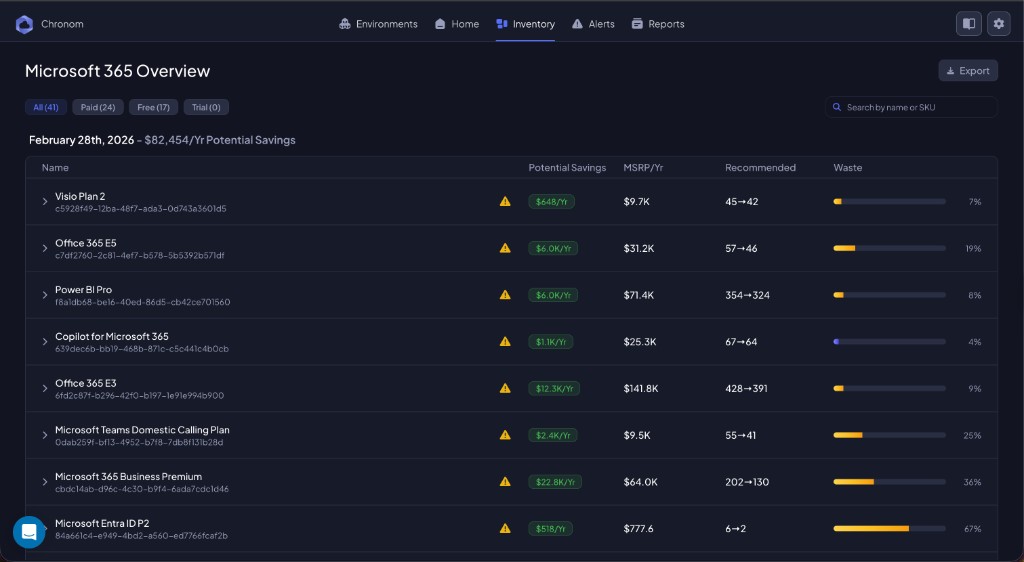
- Filter tabs - All, Paid, Free, Trial (with counts)
- Search - find licenses by name or SKU
- License table - each row shows the license Name, Potential Savings, MSRP/Year, Recommended action count, and a Waste percentage bar
Expand a license row for detailed user-level assignment data and recommendations.
Alerts
The Alerts section surfaces every finding generated by Chronom's policies across your cloud accounts.
The dropdown offers:
- All Alerts - the full alert list
- Policies - manage the policies that generate alerts
All Alerts
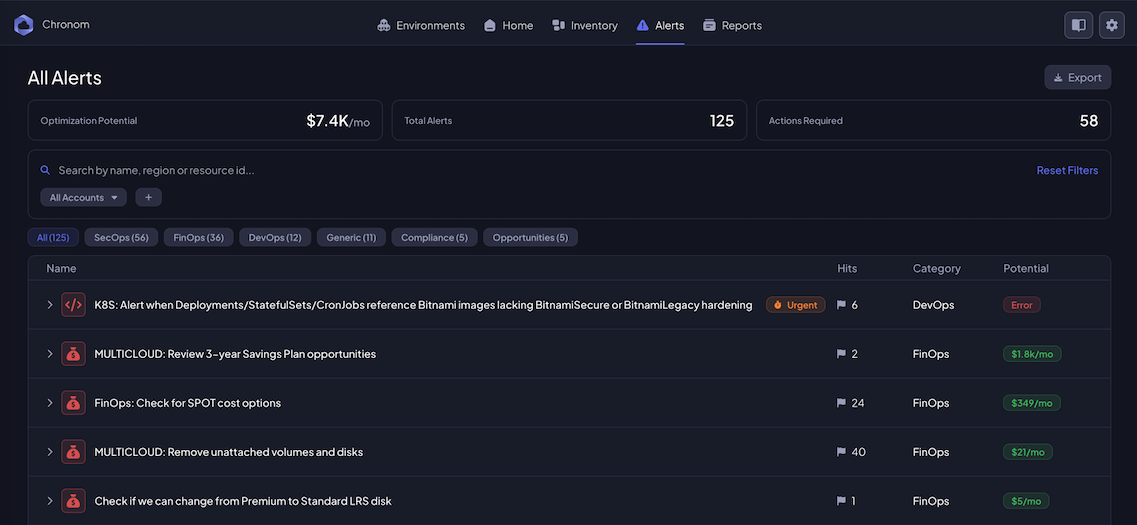
At the top, three summary cards give you a high-level picture:
- Optimization Potential - total monthly savings across all alerts
- Total Alerts - number of active alerts
- Actions Required - alerts that need manual resolution
Below the summary you can:
- Search by name, region, or resource ID
- Filter by account using the account dropdown
- Filter by category using the tabs: SecOps, FinOps, DevOps, Generic, Compliance, Opportunities (each with a count)
- Reset Filters to clear all active filters
Each alert row shows:
| Column | Description |
|---|---|
| Name | Alert title with a severity badge (e.g. Urgent) |
| Hits | Number of resources affected |
| Category | FinOps, SecOps, DevOps, Compliance, etc. |
| Potential | Estimated monthly savings or "Error" for security issues |
Click the expand arrow on any alert to see affected resources and recommended remediation steps.
Use the Export button to download the alerts list for sharing with your team or for compliance reporting.
Reports
The Reports section provides pre-built and automated reports for executive review, cost optimization, and security assessment.
The dropdown menu offers two entry points:
- Technical Assessments - in-depth technical evaluation reports
- Impact Reports - reports focused on business impact and ROI
Reports Page
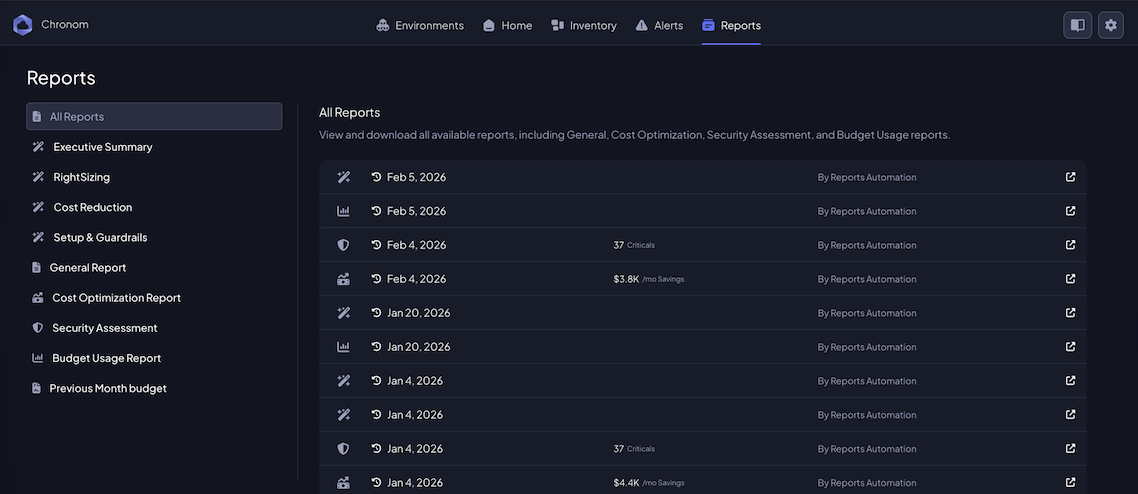
The reports page has a sidebar on the left for quick navigation between report types:
| Report | Description |
|---|---|
| All Reports | View and download all available reports |
| Executive Summary | High-level overview for leadership and stakeholders |
| RightSizing | Recommendations for right-sizing over-provisioned resources |
| Cost Reduction | Actionable cost-cutting opportunities |
| Setup & Guardrails | Status of scan readiness, operational safety, and guardrail compliance. |
| General Report | Broad infrastructure health and status report |
| Cost Optimization Report | Detailed cost optimization analysis with savings breakdown |
| Security Assessment | Security posture evaluation and vulnerability findings |
| Budget Usage Report | Budget consumption tracking and forecasting |
| Previous Month Budget | Month-over-month budget comparison and variance analysis |
Each report row in the list shows:
- Report type icon - visual indicator of the report category
- Date - when the report was generated
- Key metrics - such as "37 Criticals" or "$3.8K /mo Savings" (varies by report type)
- Author - "By Reports Automation" for scheduled reports, or the user name for manually generated ones
- Download - click the download icon to export the report
Reports are generated automatically on a recurring schedule by Chronom's Reports Automation. You can also generate reports on demand.
Contact our support team for assistance.